
Scan process module
To start a process module analysis, you need to first load the processes‘ list in the “Load” panel.
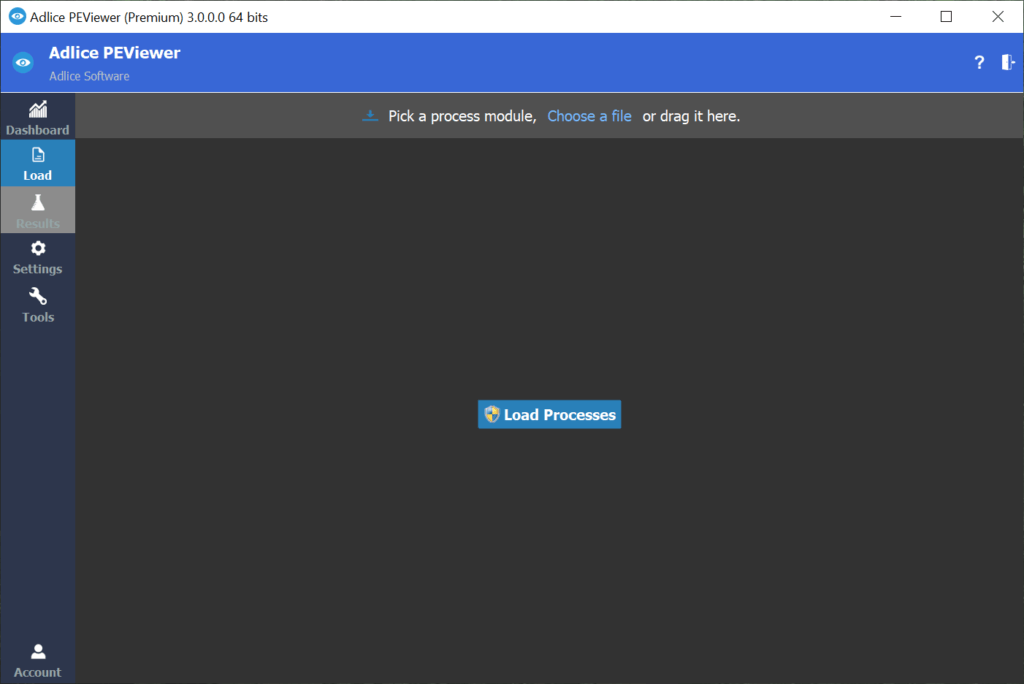
Once done, just pick** any process from the list** and a loaded module (DLL/EXE) from the right panel. Validate your choice with “Load” button.
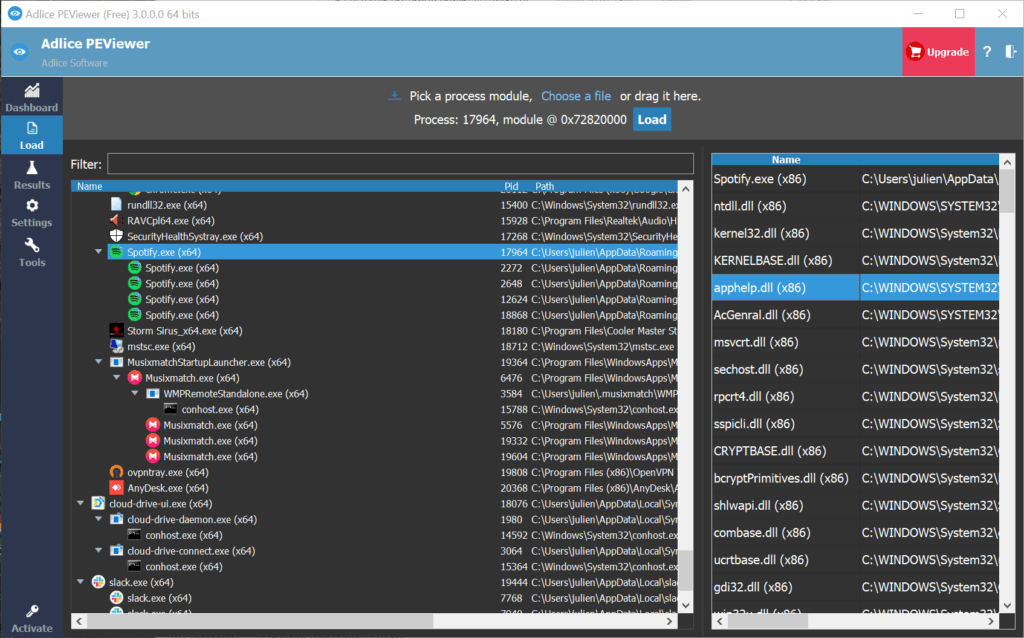
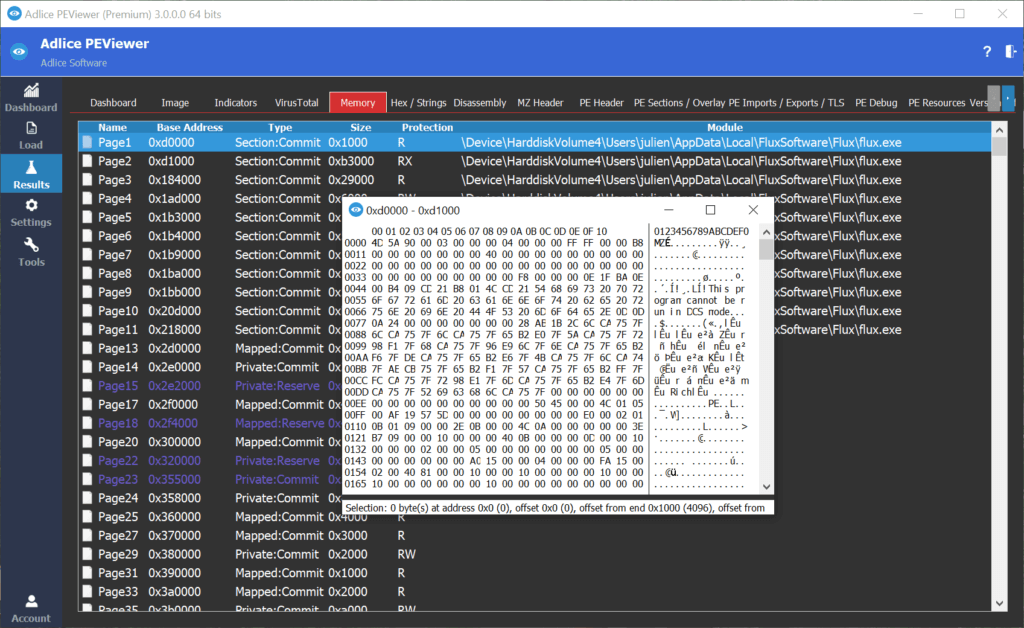
As for file analysis, the parsing starts and the PE data** is displayed in the “Results”** view. The memory (process) scan **features multiple additional layers **compared to a classic file analysis:
A. Memory tab: Displays all the memory pages used by the module. They can be dropped or inspected.
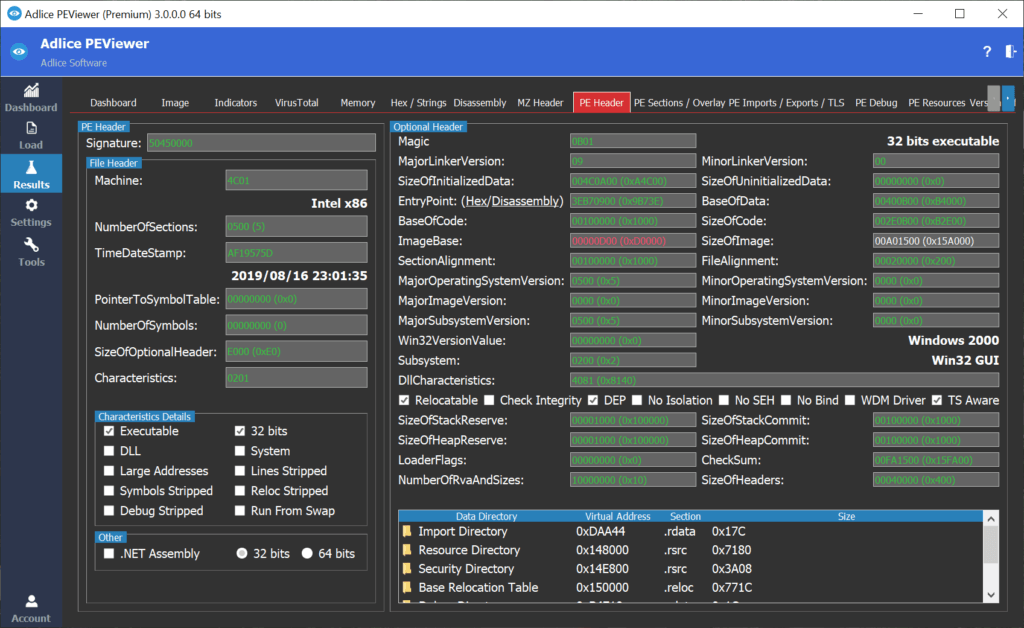
B. RunPE comparison: The PE structure in memory is compared with its image on disk. Results are displayed with a color syntax (red: mismatch, green: equal), so that it’s easy to see the differences.
C. General tab displays process information.
D. Imports/Exports tab shows possible hooks and allows to inspect disassembly of the code.