
Auto Classification
Frequency Counter
Folder Monitors
Bug ID & Call Stack
Any Debugger
Features
Everything you need, nothing you don't
Powerful Workflow
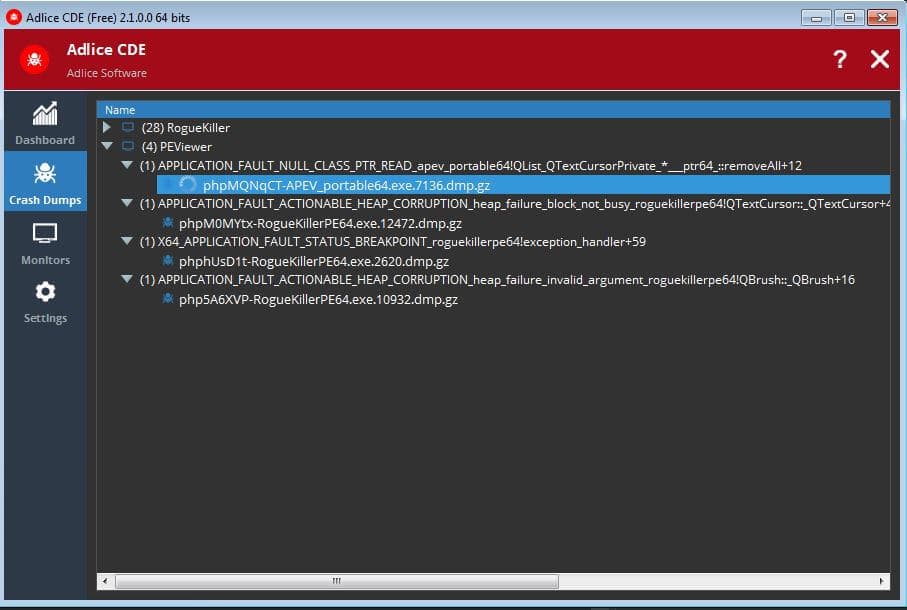
Enhance your development workflow by fully automating your crash dumps triage. CDE comes with automatic bug classification to quickly identify and classify crash dumps by issue, with a frequency counter.
- Triage runs itself.
- Point CDE at a folder and new dumps are collected and classified as they arrive, with no manual step.
- Duplicates collapse.
- Identical crashes group into one bug rather than a thousand separate files to open.
- Sorted by frequency.
- The bug hitting the most users sits at the top, so the first dump you open is the one worth fixing.
Data Extraction
CDE extracts all the interesting information from your crash dumps: call stack, bug ID, software name and version — so you can quickly tell if a bug was already fixed or is a regression.
- The call stack, extracted.
- The faulting stack is pulled from the dump and shown directly, with your own frame marked.
- Name, version, bug id.
- Each dump carries which build it came from, so you know exactly what was running.
- Fixed or regression?
- Comparing the version against a known fix answers that before you open a debugger at all.
Compatible with your tools
Crash dumps open in your default debugger, whether it's Visual Studio, WinDbg or anything else compatible. Don't waste time on triage — just plug it in and create a monitor.
- Your debugger, not ours.
- Dumps open in Visual Studio, WinDbg or whatever you already use — CDE does the triage, not the debugging.
- Plug it in.
- Create a monitor on a folder and the workflow is running; there is nothing else to configure.
- Straight to the fault.
- Open a dump from the list and it lands in your debugger already pointed at the crash.
What users say
Trusted by people who clean real machines
It increased my productivity
“As a product manager and developer I know how precious crash dumps can be. I've used CDE for a couple of weeks and it's a very good asset — I reduced my workload by automating the collection and analysis of crash dumps. They're now in my monitors, already sorted by priority. Before opening a dump, I already know the software version and even the possible issue. Only remains to fix it!”
Eddy S.
February 2019
Get it now
Download CrashDumpExtractor
Latest version · v3.9
- OS:
- From Windows 7 SP1 to Windows 11
- Arch:
- 32-bit, 64-bit & ARM64
By downloading, you accept the EULA.